Graphical user interface
As of version 1.0.0 the graphical user interface for TAVI looks like
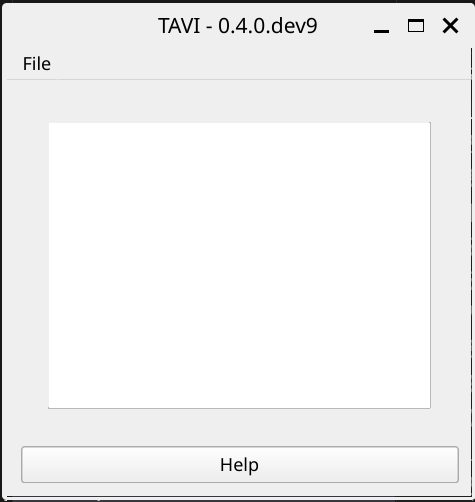
One can use TAVI for: * data visualization * combining different scans * performing fitting of the peaks.
Validation
The graphical user interface will provide a visual feedback as a pop-up window for an errors ursers might encounter.